Improving Service Reliability
Egnyte employees strive every day to minimize service error rates. We use various methods to measure performance and error rates across the system and, following every release we analyze to identify issues that need to be fixed before they impact our customers. Let me take a deeper dive into a few of the things we do.
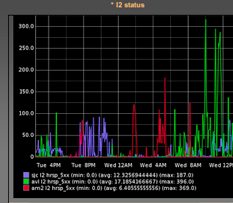
Track error rate globally: All of our traffic flows through internal Haproxy servers. A script feeds off the live stream and posts 5XX status requests to Graphite server every 5 minutes - if the error rate crosses a predetermined threshold, a Nagios alert is fired to trigger immediate investigation by the operations team. The operations team will take help from engineers to mitigate these issues if a workaround is possible and the support team will be notified so they can publish them on Zendesk. In case of a blocker issue with no workaround, a hotpatch is created and tested by the QA team and then applied to the affected nodes.

Track error rate of critical components: Some components, such as Egnyte Sync, are very critical to our business, so we measure them at a very detailed level. At the end of a client sync, stats are sent to cloud and these are fed into our analytics system. The system then produces reports, which detail how the sync process is doing across various dimensions such as client type, customer, data center or version. If an issue is identified, the operations team works with Sync team to mitigate the issue before it impacts customers.Track error rate by URL: Since we follow a service-oriented architecture every Egnyte engineer may not know about every service URL, so we generate a report per service. Engineers responsible for each service analyze the report for anomalies and fix them for the next release. A cron job runs nightly that tracks every URL by parsing Haproxy logs and generates trend reports per service. Once its finished, the cron job sends out an email that contain information about:
- Top 25 URLs: To helps us detect any abnormal surge in URL usage.
- Top 25 URLs with errors: To help us identify URLs with a high error rate.
- Top 25 customers with errors: To enable us to mitigate errors affecting one customer in large quantity.
Below is a sample report, which includes:
- Up and down arrows with % deviation to track jump in error rate for a particular URL.
- New errors are shown in red so we can focus on them first.
- Each metric can be clicked to open up a Graphite graph that shows trend report at daily/weekly/monthly level.
- Each URL avg msec is tracked to monitor performance issues.
Track exceptions: We generate exceptions report at a global, data center and node level. We’ve added an interceptor in our logging framework that keeps track of exception stats. A cron job looks at the last 24-hour logs and generates a report as shown below.We generate a table of exceptions at global, data center and node level.
- Each exception gets a unique graphite metric - we can click on the count to generate a graph.
- We plan to integrate this report with logstash so we can click on the exception to see the detailed trace of this error.
- We run the report 6 hours after the latest release is live to see if anything has popped up.
- Every morning each team lead looks at the report and we try to fix as many exceptions as we can in next release.
- Some exceptions are validation exceptions such as permission exceptions; we keep track of those in a different table.
Track UI errors: We use MixPanel analytics platform to keep track of every Ajax call that is made to the cloud and it enables us to catch and fix issues before it impacts entire customer base.Egnyte is committed to provide a highly scalable and reliable service to our customers and we take every possible measure to act quickly to identify and rectify issues as early as possible. And we want to hear from you about how we’re doing and what we can do better. Leave your comment below with your feedback and suggestions.


