My First Year at Egnyte: An Engineer’s Perspective
I am a software engineer on Egnyte’s Cloud Infrastructure team where we create, maintain, and optimize backend services used by the rest of the Egnyte platform. In a recollection of my first year with the company, I review my path from starting as a new hire to pushing a very significant, large performance change that affects some of our most trafficked endpoints.
After graduating from college, I had a strong desire to experience the software industry firsthand. I wanted to contribute my part to the environment that shaped my interest in software development and the world of tech at large. After a year of stimulating challenges and opportunities to grow as both a coder and software engineer, I reflect on both the new hire experience and a few of the projects I have tackled at Egnyte.
During my first week at Egnyte, I completed our introductory Bootcamp experience and sat down with project managers, senior engineers, and members of our sales team to get a feel for the platform and where my work would fit in. I worked in a variety of areas during this time, working with folder/file metadata, our release test suite, and a variety of public and private APIs.
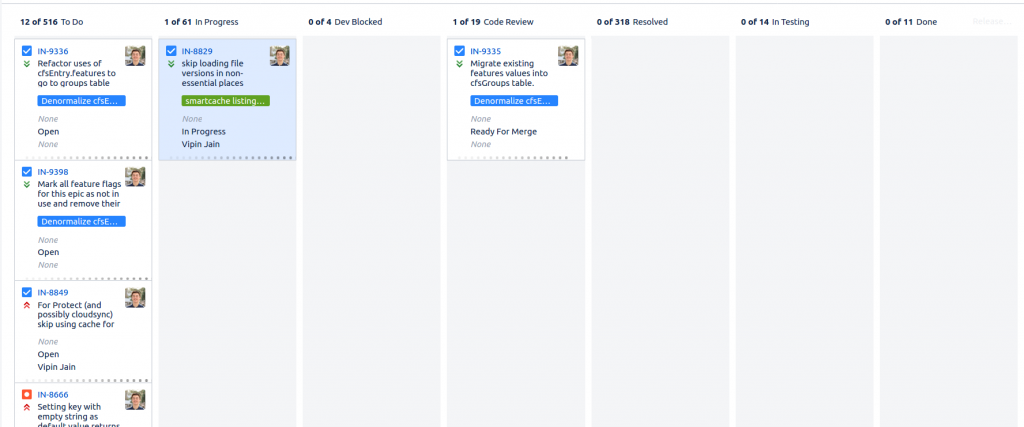
We coordinate our work with other engineers and project managers using a ticketing system organized around a team-centric Kanban board.
A typical development cycle for one of these tickets generally involves:
- Programming,
- Unit & functional testing,
- Code review, and
- QA testing steps
These all happen before any changes are rolled out to production.

As my responsibilities shifted toward tickets with a larger product impact, I began providing more end-to-end supervision of my work, which allowed me to learn about our application performance monitoring (APM) tooling.
Egnyte strives to provide a world-class quality data governance and collaboration platform. To that end, we constantly monitor infrastructure services to mitigate usage spikes and performance issues before they become problematic. We organize a huge amount of application metrics in Grafana dashboards that provide us with time-contextual clues to identify performance oddities. We also produce an equally large amount of logging aggregated in Kibana for debugging.
Here is a sample graph showing how much data flows through one of our most critical caching layers in just one datacenter.

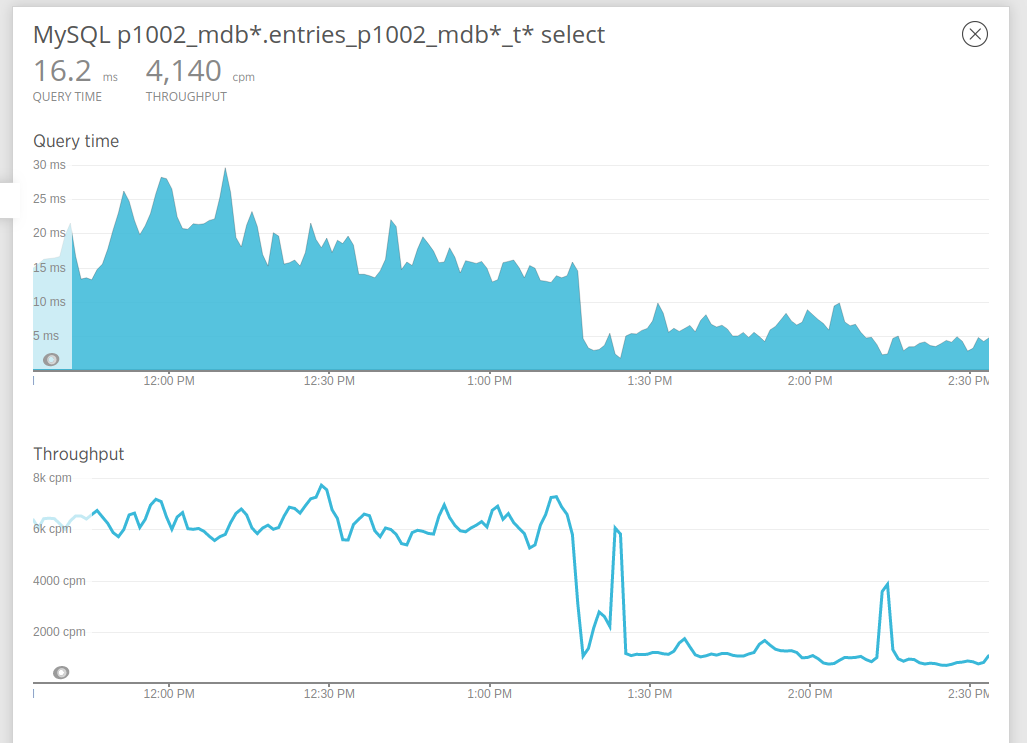
When it comes to understanding performance and usage of our backend services at scale, we employ a number of APM and performance measuring and alerting components including New Relic. We profile our major transactions to visualize performance and other hardware and software statuses. In my case, this tool has been indispensable for providing concrete evidence of the success or failure of performance-related work.

During the week of my work anniversary, I rolled out a large performance optimization to our folder listing flow to conclude my first year at Egnyte.
We had noticed that one of our main use cases was working slower at scale than other code that processed a similar breadth of data. While investigating, I learned that we were always loading the full version history of a file into memory when in reality we used only the most recent version in over 99 percent of cases. Due to a previous effort to refactor our databases and avoid costly joins, I discovered I could rely on denormalized data and remove an expensive join query, potentially saving quite a bit of time in 99% of cases. I protected my changes under a feature flag to ensure zero risk of downtime for this very highly trafficked endpoint and refactored the code to act on a much simpler data type.
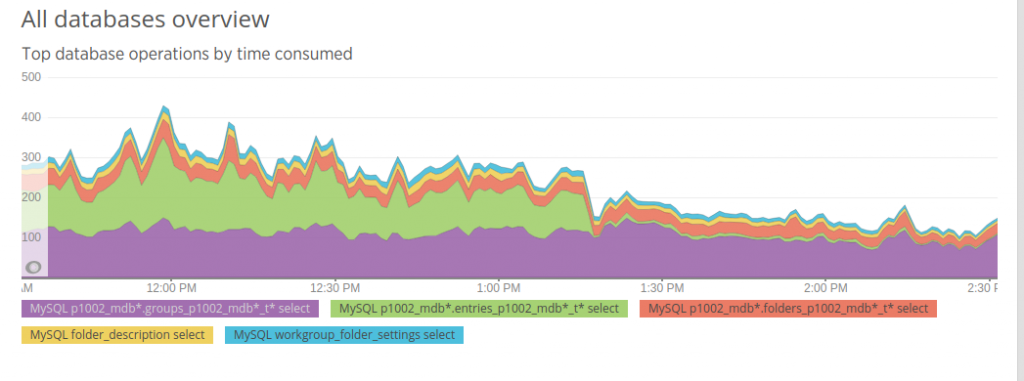
As I rolled this change to production, I was interested in the relationship between the now dropped database calls and transaction latency. As around 90% of version-fetching DB calls were now dropped, I saw a decrease in DB interaction that was significant even when looking at overall DB performance for our datacenters. Hand in hand with this result was a 25% drop in overall transaction latency as well as an increase in transaction throughput, freeing up our servers to take on more work, improving performance for our customers, and reducing costs for Egnyte!

With much lesser DB interaction, I observed an equally significant drop in cache transaction count and a radically smaller transaction size. One data center’s cache interaction dropped from over 2GB/min to under 500MB/min once this change was fully rolled out.

While these results were exciting, I was able to check cache transaction health to make sure my change was purely positive in nature. Consulting a metric created for tracking successful and unsuccessful calls, I was able to verify that our speedup was due to my change and not caused by an increase in failures to communicate with the cache.

Together, all our APM tooling infrastructure gives a junior engineer such as myself the confidence and certainty to work on such high-impact/high reward projects. Of course, there is the great mentorship of my peers on the Infrastructure team that contributes to my success as well. I have enjoyed working alongside an intelligent and capable team of engineers (not to mention great Egnyters in all departments of the company). Learning opportunities are abundant here, both in terms of technical abilities and in terms of my competency in working with a fast-moving production environment. I look forward to all the other challenges and experiences that I’ll have here with Egnyte!
Photo by Markus Spiske on Unsplash


